Supersymmetry is one of the most popular theories in theoretical physics. Really, it’s a large set of theories which are used to address, among other things, what is known as the Hierarchy problem. The Hierarchy problem, in a nutshell, is the issue of why there appear to be two very different scales in the universe. The energy scale of W, Z and Higgs bosons (collectively known as the “Electroweak” scale) is much smaller than the energy scale of gravity (the “Plank” scale): the masses of W, Z, and Higgs bosons are all around 100 GeV, where as the intrinsic energy scale of gravity is around 10^19 GeV. In our current understanding of physics, this difference seems to come about due to almost miraculous fine tuning in physical equations. Such perfection seems unnatural in the way it works together. Generally, physicists don’t prefer that their physical equations rely on arbitrary coincidence to work. Instead, theories like Supersymmetry introduce new particles which instead lead to a natural and beautiful solution to the hierarchy problem.
Because the theory of Supersymmetry introduces a wide spectrum of new particles, it is directly testable in experiments like ATLAS at the LHC. Of course, other accelerators have been searching for Supersymmetry (often shortened to SUSY) for some time, and no one has yet been able to discover any SUSY particles. When a physicist fails to make discovery, he can instead set limits. He can essentially say, “If SUSY of this form or that existed, we would have seen it in this experiment. Since we didn’t, we can now restrict the possible forms of SUSY that could potentially exist.” This is all we’ve been able to do thus far. Recently, using 2010 data, experiments at the LHC have managed to set the strongest limits yet on SUSY theories.
Before we get into that, let’s talk a bit about how one looks for SUSY at a particle accelerator. Well, one does that is essentially the same way that one looks for any other physical signature: one determines how that signature would look, what particles would emerge from it, how they would interact with the detector, and what properties those particles would have. One also considers other physical processes that, by looking similar, can mimic the physical process of interest, and one attempts to measure how much of these “backgrounds” would be present.
To be very concrete, let’s look at a plot released by a recent ATLAS paper on SUSY:
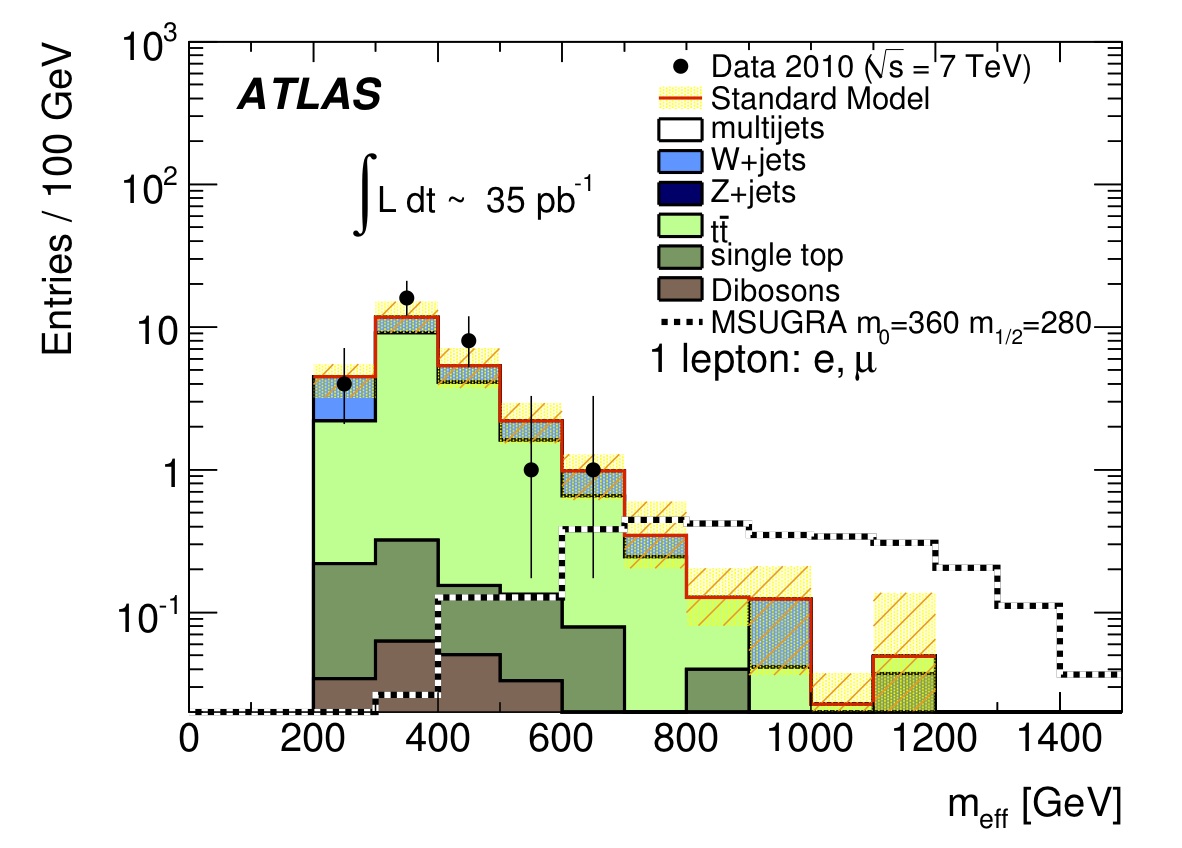
This plot shows several things at once. The x-axis is a quantity which this paper calls the “effective mass,” which here is a combination of the energy of jets, leptons, and missing energy of a collision event. It isn’t strictly necessary to understand the exact nature of this quantity to interpret this plot. The y-axis is the number of events measured or that one would expect to see in a particular bin (notice the logarithmic scale). Each of different colored stacks represents the expected distribution of a some background (most of these distributions come from simulation). For example, the dark and light green stacks come from top quark events, the dark brown comes from a class of processes labeled “Diboson,” and the small amount of blue comes from W-bosons. The dotted white and black lines are where SUSY would be if it were present. Finally, the solid black dots are the actual data: they’re what was actually measured by the detector. If SUSY existed, one may expect there to be black dots out by the SUSY curve toward the right. However, we see no such dots (it should be noted that, if you look at the y-axis, the expected number of events is less than 1 in that region, so it’s possible for SUSY to exist but not show up on this graph. This is a somewhat low-statistics analysis). Instead, you do see the black dots at the top of the stack of backgrounds, where we expect them to be, where they are predicted to be by the Standard Model.
To evaluate how strongly the experiment’s data supports or excludes a SUSY theory, experimentalists construct statistical models to describe various potential theories and determine which of these models is closest to the observed data. Of course, I’m glossing over what I think is one of the most interesting parts of the discovery process, but I would need a much bigger space to accurately describe the statistical techniques used at ATLAS. But using the observed data and some nice statistics, ATLAS, as well as its rival experiment CMS, have managed to put very strong limits on how SUSY must look, if it exists at all.
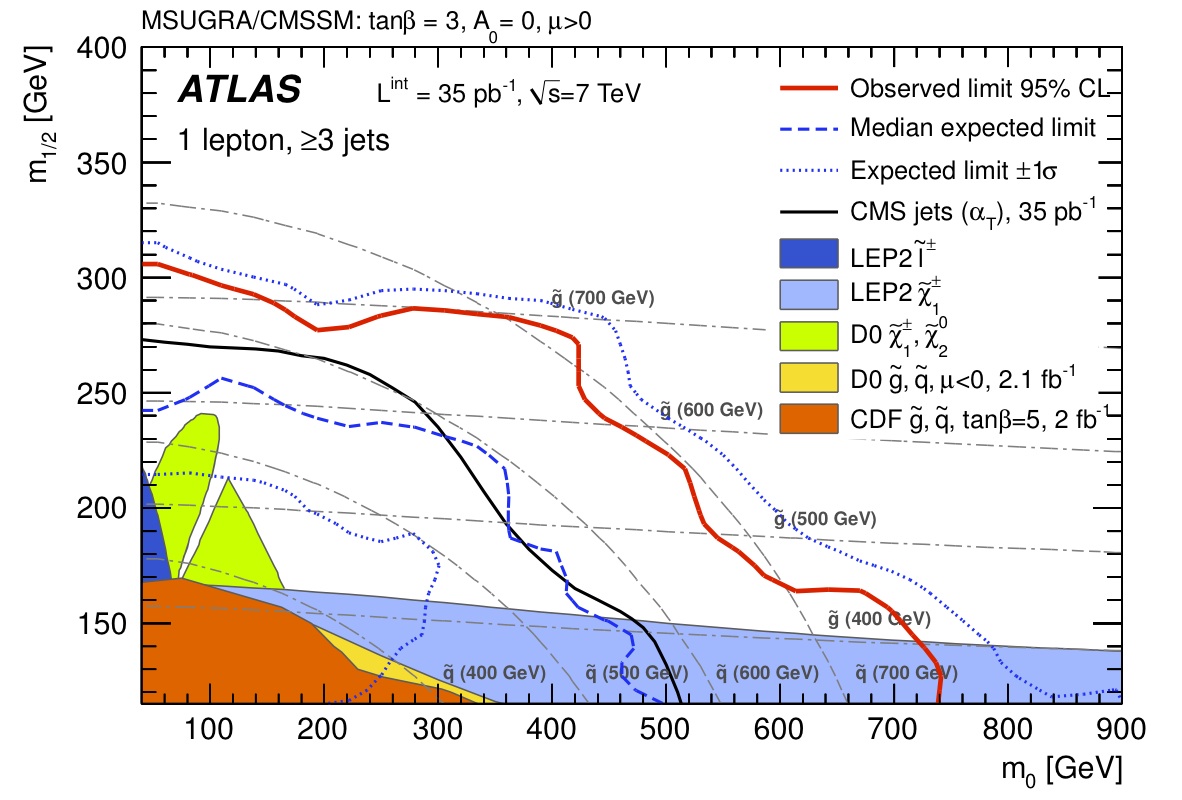
This plot shows these newly placed limits. As I said earlier, SUSY is really a collection of theories, and many of these are parameterized by some standard quantities. Each point in this plot represents one particular theory in a continuum of theories, each with different values of two x-axis and y-axis parameters (again, their exact meaning isn’t necessary to describe here). The colored blobs on the bottom-left of the plot are limits that have already been placed by earlier experiments. Areas shaded in those blobs are “excluded,” meaning that a SUSY theory with those parameters have been experimentally rejected (with a 95% confidence level). The red line represents the NEW limits from ATLAS, and the black line is the limit placed by CMS. Areas below and to the left of those lines have been excluded by these experiments (here, ATLAS places a slightly stronger limit than CMS). The other blue lines describe what limits one would EXPECT to observe and have been included to give context to the actual OBSERVED limits.
These limits only apply to a small subset of all possible SUSY theories. In reality, SUSY has tens of free parameters, and it would be impossible to draw on a piece of paper the 30 or so dimensional space of SUSY models that have been excluded by this new experimental data. This is unfortunate, particularly because it means that many people think of SUSY in a narrow way since, historically, only a few parameters or a few particular models appear in papers. This is arbitrary, and there’s no real reason that SUSY should conform to the taste or historical tradition of physicists. Instead, to describe physical results in a more general way, experimentalists should strive to break out from the tradition of publishing only a small subset of the excluded space. In the example of SUSY, it would be much preferable to instead publishing the entire, 30-dimensional space of excluded theories. Again, it’s impossible to draw this on paper, but it’s the 21st century, and the concept of publishing should conform to the world in which we live. Physicists could release the excluded space as some persistent data-structure in one form or another that a person could project into any subspace he desired for the sake of visualization. So, if a theorist weren’t interested in the two parameters that were published on the arxiv paper, he could instead view the excluded hyperspace in any 1, 2, or 3 dimensional space of SUSY parameters. It’s time that physics publications catch up to modern times.